The Beginners’s Guide To Price Action Trading: Introducing Price Action Trading
What is Price Action Trading? This is a method or a strategy that is used by traders. This relies on historical prices (open, high, low, and close) to help traders make better trading decisions.
Price action tells you what the market is doing without the need or help of too many indicators or algorithms that make your charts look like a drawing pad scribbled by nursery children.
How does Price Action benefit beginner traders?
Price Action trading is the most basic form of trading strategy that teaches traders about how to read trends and historical prices. This also helps in timing your entries and exits with precision. Price Action Trading has sub-strategies that would greatly help in in your trading decisions. These sub-strategies consist of the following: support and resistance, candle patterns and more.
IDENTIFYING TRENDS
Identifying trends is one of the basic skills that a beginner trader should master.
A trend is the movement of prices in a certain direction over a period of time. Trends can be long term or short term in an upward, downward or sideways movement. This is very important because once you master reading trends, you will be able to position yourself for a profitable entry and exit points.
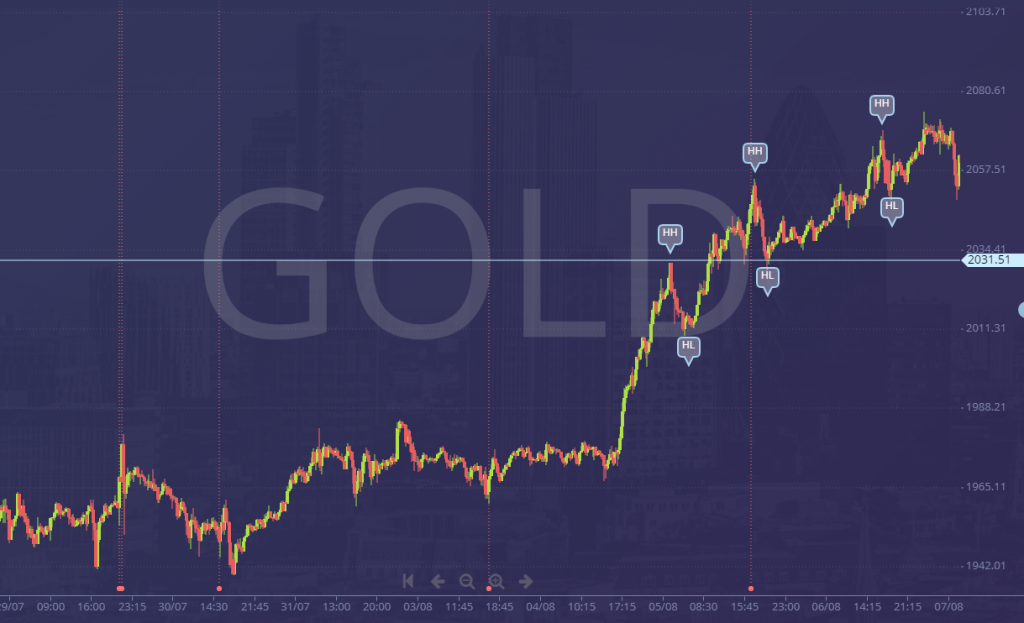
Trends are usually noted by higher highs(HH) and higher lows(HL) in an UPTREND
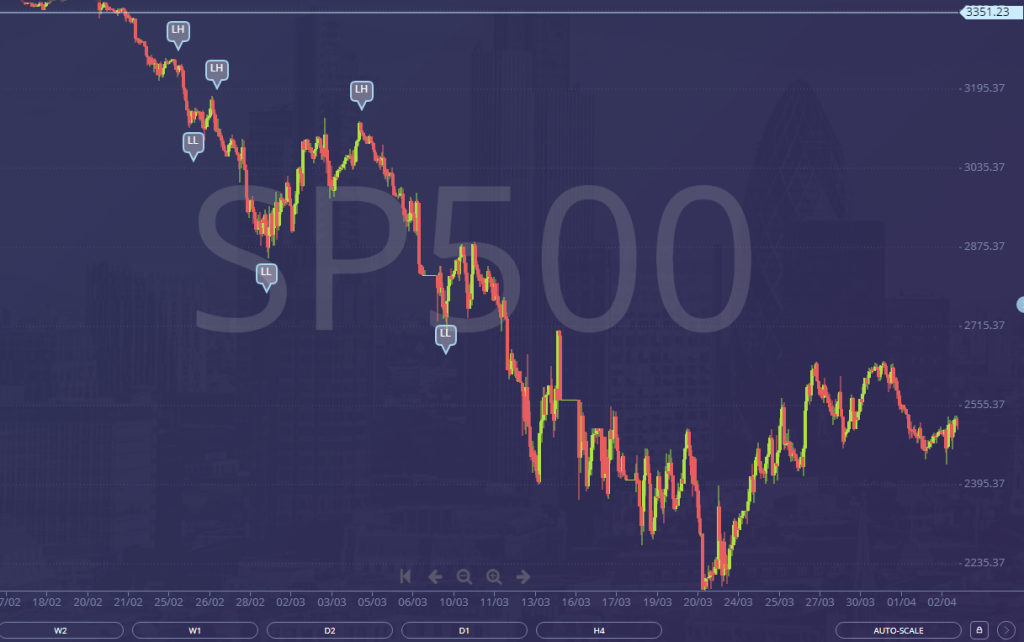
While Trends in a DOWNTREND are noted in lower highs(LH) and lower lows(LL)
One of the first things that you would want to identify is the timeframe of a currency pair that you would like to trade on. There are different timeframes that you could look into from the monthly charts, weekly charts, daily, 4 hour, 1 hour, 30 minutes, 15 minutes charts and so on.
By identifying the timeframe in which you would like to trade, it will also help you in identifying in which type of trading strategies that you would like to use for a particular timeframe of a chart.
The market moves in a certain cycle almost like a pattern-like movement that has been observed by many traders and have profited from these patterns especially those who use trend-based strategies such as the Trend Wave and 180 Phase Changer. We will talk about these strategies in a later article to show you how price action trading with other trend-based strategies work and how it can improve your probabilities in trading.
Liquidity is important in trend-based strategies. The more liquid a currency pair is, the more movement we expect especially when we are trading with major currencies such as EUR/USD, USD/JPY, GBP/USD and USD/CHF. The more volatile a currency pair is, the more opportunities there are for price to move strongly in one direction.
Here, we will discuss about the market stages that you will most likely encounter when reading charts.
4 STAGES OF THE MARKET
Before we learning how to follow a trend, first we should learn about the 4 stages of the market.
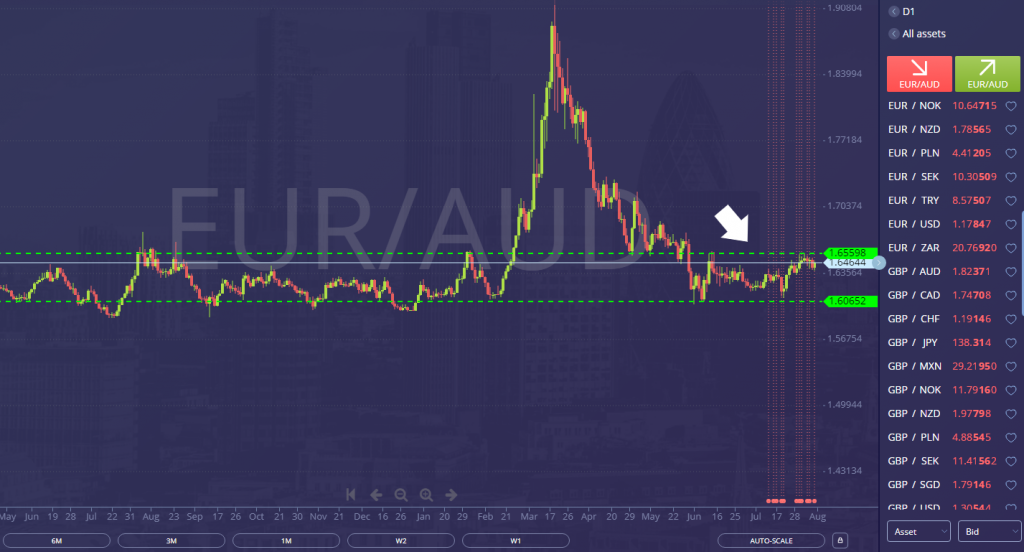
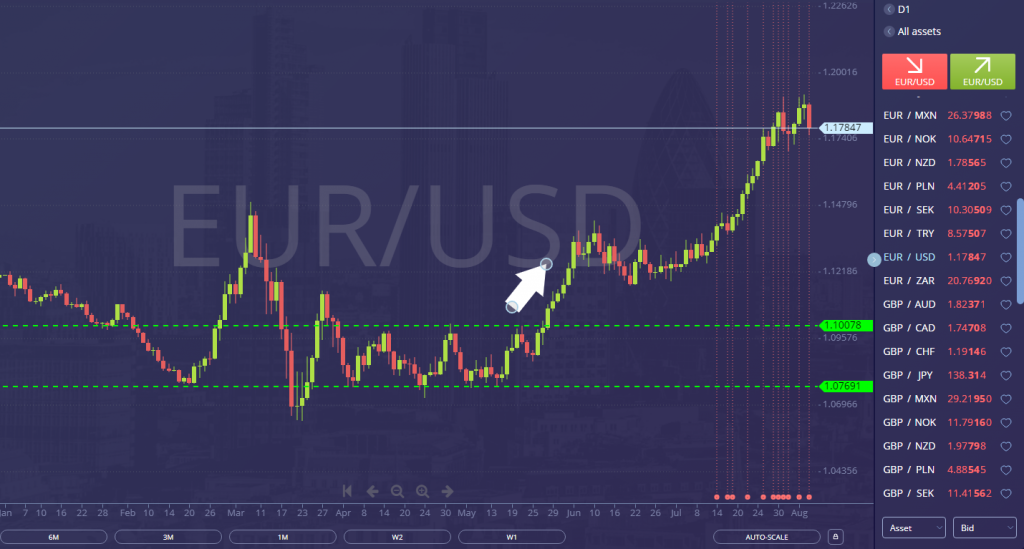
Accumulation Stage – This stage is a range that usually forms after a downtrend. One of the reasons why there is an accumulation is that there are buyers/bulls starting to come in and trying to push the market in a higher price while on the other hand, the seller/bears are also still trying to push the prices lower. This is usually a sign of an indecision in the market. Here is an example of the accumulation stage.
Advancing Stage/Uptrend – This stage is a result of the price breaking out from the accumulation stage. After a long exhaustive accumulation stage, the sellers/bears have been exhausted and the buyers/bears have succeeded in pushing the price higher thus resulting in an uptrend signaling a control by the buyers. Here is an example of the advancing stage.
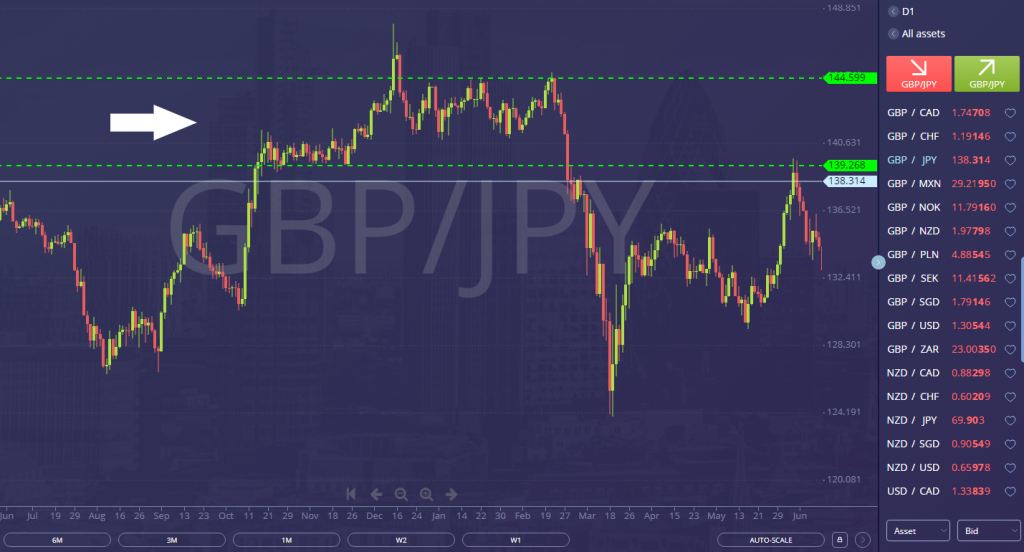
Distribution Stage – This stage is like the accumulation phase. Although, this stage forms right after the advancing stage/UPTREND rather than after a downtrend. Here the buyers/bulls are in equilibrium with the sellers/bears once again signaling an indecision in the market. Here is an example of the distribution phase.
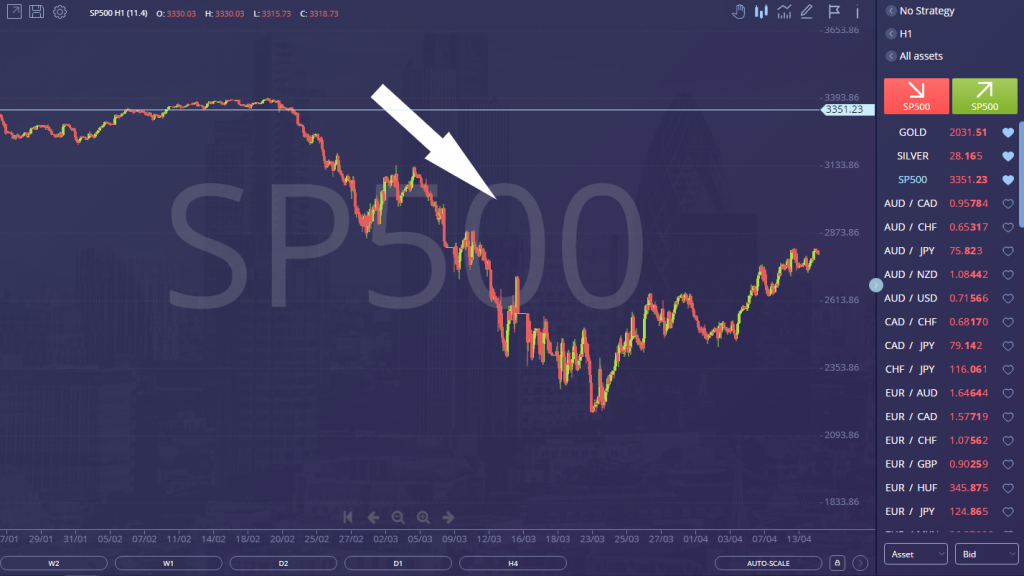
Declining Phase/Downtrend – This phase is where the sellers/bears gain control of the market pushing the price lower after having an indecision with the buyers/bulls in the distribution phase. Here is an example of a declining phase.
Now that you know how to read a trend, always remember that these trends and patterns are always relative to changes. As a beginner trader, allotting a minimum of 15 minutes of your time reading charts every day will help you identify trends faster and easier.
In the next article, we’ll be talking about support and resistance and moving averages. For new traders, these terms may sound a bit technical but you’ll get used to it once you start doing it.
Don’t forget to follow and subscribe Learn To Trade Philippines for more daily updates on news, trends, analysis, facts and more on FOREX TRADING!
To learn more about forex trading and how to profit in this financial market, sign up now reserve your FREE seats while it still lasts!
Risk Disclaimer:
Information on this page are solely for educational purposes only and is not in any way a recommendation to buy or sell certain assets. You should do your own thorough research before investing in any type of asset. Learn to Trade does not fully guarantee that this information is free from errors or misstatements. It also does not guarantee that the information is completely timely. Investing in the Foreign Exchange Market involves a great deal of risk which may result in the loss of a portion or your full investment. All risks, losses and costs associated with investing, including total loss of principal and emotional distress, are your responsibility.


")


