The Beginners’s Guide To Price Action Trading: Moving Averages and Candlestick Patterns
Since our last discussion on our previous article on the beginner’s guide to price action trading, we will now continue to tackle about other strategies that can help you in price action trading.
Now that you have learned the big picture of price action trading, understand where to place your trades on support and resistance as well as what you should do in different market conditions in the 4 stages of the market, it will be easier for you to read trends in a chart.
Today, we will talk about MOVING AVERAGES and CANDLESTICK PATTERNS.
MOVING AVERAGES
In technical analysis, you should know that Support and Resistance are horizonal areas used in your charts. Mostly, it is plotted on ranging markets.
While Moving Averages otherwise known as DYNAMIC SUPPORT AND RESISTANCE are used in trending markets whether it’s an uptrend or a downtrend.
In moving averages, the support and resistance is moving along with the prices as new bars appear.
For example:
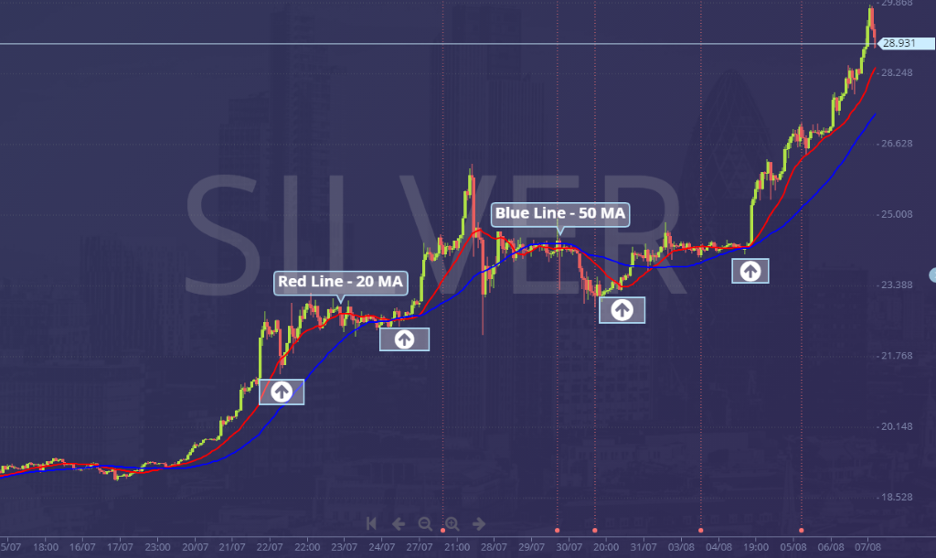
In a strong uptrend market, you can see that the 20-period moving average is moving with the prices and acts as a dynamic support. Here, in this example, you can see the 20 MA touching the prices. The 20 MA should also be above the 50 MA to confirm a strong uptrend.
In a downtrend, you can see the 50 MA touching the prices dynamically and acting as resistance with the 20 MA under the 50 MA further confirming a strong downtrend.
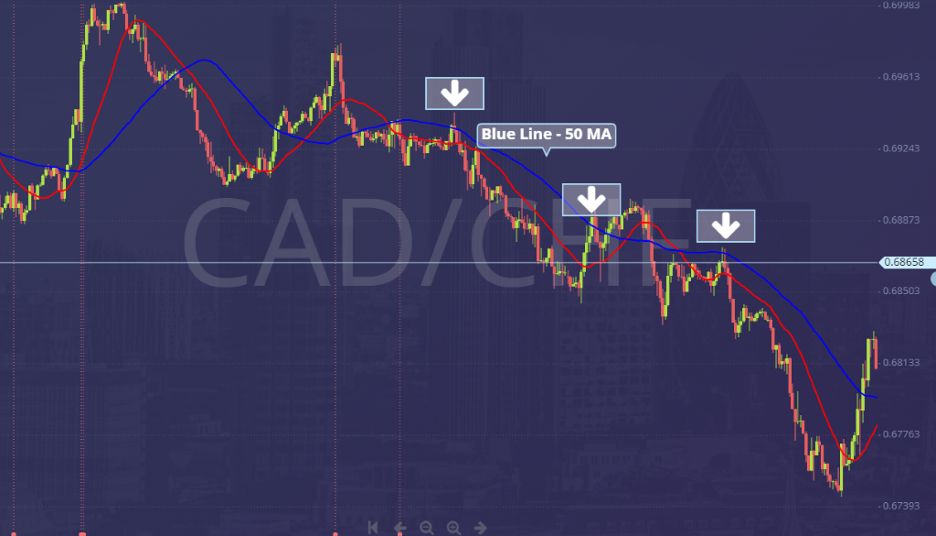
The moving averages helps you analyze a strong trend whether it’s an uptrend or a downtrend as long as you follow the principles that we taught in the examples. If the prices are above and touching the 20 MA with the 50 MA slightly apart from the 20 MA, the chances of the prices pushing higher is stronger. The same concept can be used in a downtrend, the only difference is the prices are diving below both moving averages and the prices are touching the 50 MA that acts as a dynamic resistance.
CANDLESTICK PATTERNS
A candlestick is a way of displaying information on a currency pair’s price movement. A lot can be said with just reading the price bars. Candlestick patterns can also help you enter a trade.
We’ll talk about some of the most common candlestick patterns and how you can benefit with them.
HOW DOES A CANDLESTICK PATTERN WORK?
A candlestick has 4 data points:
Open – The opening price
High – The highest price over a fixed time period
Low – The lowest price over a fixed time period
Close – The closing price
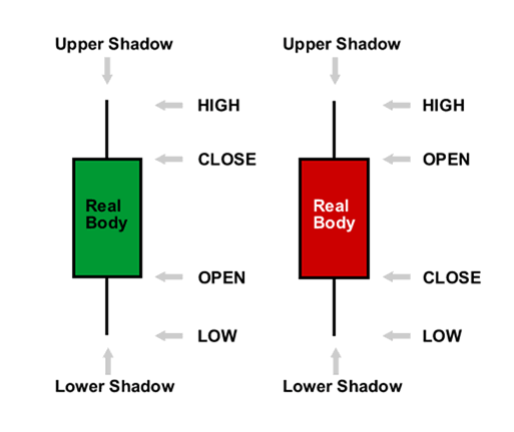
For a Bullish Candle, the open is always below the close with a green body.
For a Bearish Candle, the open is always above the close with a red body.
THE 4 MOST POWERFUL REVERSAL CANDLESTICK PATTERNS
These 4 candlestick patterns that we will talk about are the most common used patterns by traders that helps them enter their trades.
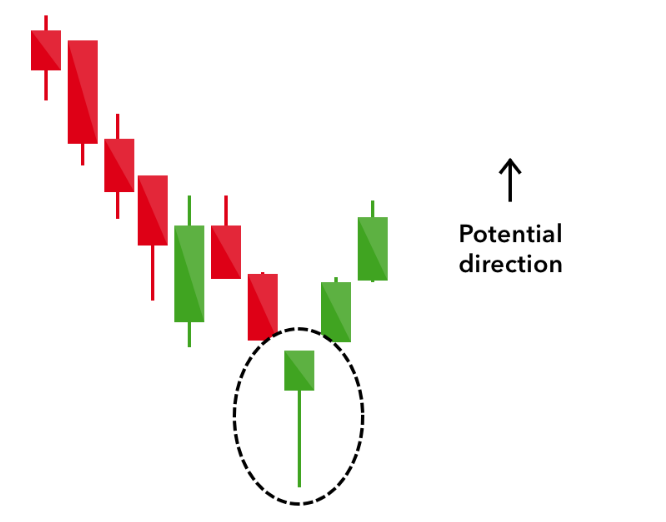
HAMMER
![]()
This hammer candlestick looks like a hammer hence what it is called. This usually forms after a decline in price.
A hammer has the following characteristics:
- Just a little upper shadow/wick or no shadow at all.
- The price closes above the opening at ¼ of the range of the body.
- The lower shadow/wick as about 2 or 3 times the length of the body of the candle.
What does a hammer mean?
- Upon the opening of the market, the sellers took control and pushed the price lower
- At the climax of the selling, huge buying pressure stepped in and pushed the prices higher
- The strong buying pressure led the candle to close above the opening price.
- Usually found in a downtrend, once formed it is signaling a possible reversal.
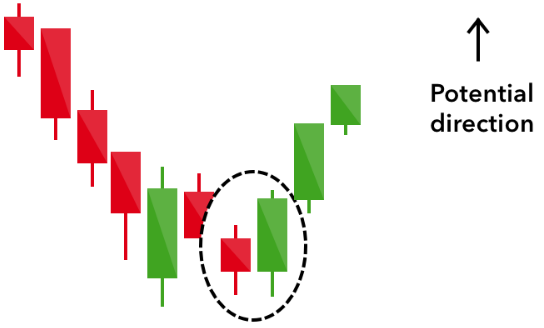
BULLISH ENGULFING PATTERN

The bullish engulfing pattern is from by two candlesticks.
A bullish engulfing pattern has the following characteristics:
- The first candlestick has a bearish close.
- The second full bodied green candlestick formed completely larger than the first candlestick.
- The second candle has a bullish close.
What does a bullish engulfing pattern mean?
- On the first candle, the sellers came in pushing the price lower signaling a strong selling pressure.
- When the second candle formed, buying pressure stepped in and pushed the price higher than the opening of the first candle signaling victory for the buyers.
- Usually found on a downtrend and can be a sign of a reversal.
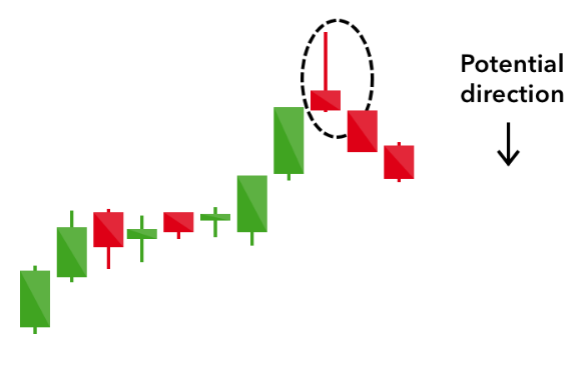
SHOOTING STAR

A Shooting star is similar to the hammer but inverted. Usually forms after a decline in advance price.
A shooting star has the following characteristics:
- Little or no lower wick/shadow
- The price closes below the opening at ¼ of the range of the body.
- The upper shadow/wick as about 2 or 3 times the length of the body of the candle.
What does a shooting star mean?
- When the market opened, the buyers took control and pushed the price higher. As you can see in the example of the shooting star, the upper shadow states the highest price it reached during that period.
- When the sellers stepped in, the selling pressure was so strong that it pushed the price lower drastically.
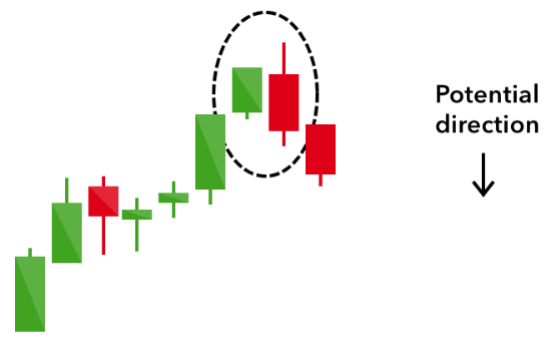
BEARISH-ENGULFING PATTERN

The bearish engulfing pattern is from by two candlesticks just like the bullish engulfing pattern but this time, the bullish candle opens first while the second candled closed bearish.
A bearish engulfing pattern has the following characteristics:
- The first candlestick has a bearish close.
- The second full bodied green candlestick formed completely larger than the first candlestick.
- The second candle has a bullish close completely engulfing the first bulling candlestick.
What does a bearish engulfing pattern mean?
- On the first candle, the buyers came in pushing the price higher signaling a strong buying pressure.
- When the second candle formed, selling pressure stepped in and pushed the price lower than the opening of the first candle signaling control by the bears.
- Usually found on an uptrend and can be a sign of a reversal.
Now that you know some of the common candlestick reversal patterns that forms in the market. You can now step up your game in price action trading with the help of candlestick patterns. However, these patterns don’t always work in our favor so it’s best that you use this in discretion and wait for another candle to form after the pattern to confirm the potential direction of the trend.
There are also other ways on how to spot entry triggers and exits which we will be talking about in a later article. Don’t forget to follow and subscribe for more updates about market trends, analysis, forex news, strategies and more!
Do you want to learn more about forex trading? Sign up now on our FREE forex webinar and reserve your FREE seats while it still lasts!
Risk Disclaimer:
Information on this page are solely for educational purposes only and is not in any way a recommendation to buy or sell certain assets. You should do your own thorough research before investing in any type of asset. Learn to Trade does not fully guarantee that this information is free from errors or misstatements. It also does not guarantee that the information is completely timely. Investing in the Foreign Exchange Market involves a great deal of risk which may result in the loss of a portion or your full investment. All risks, losses and costs associated with investing, including total loss of principal and emotional distress, are your responsibility.


")


