The Beginners’s Guide To Price Action Trading: Identifying Strength and Weakness in the Market
We all know that the market does not move in one straight line. You can notice that it’s a pattern of upward and downward movement. You can classify this pattern as:
- Trending Move
- Retracement Move
Let us further discuss this movements in the market and use it to our advantage.
Trending Move
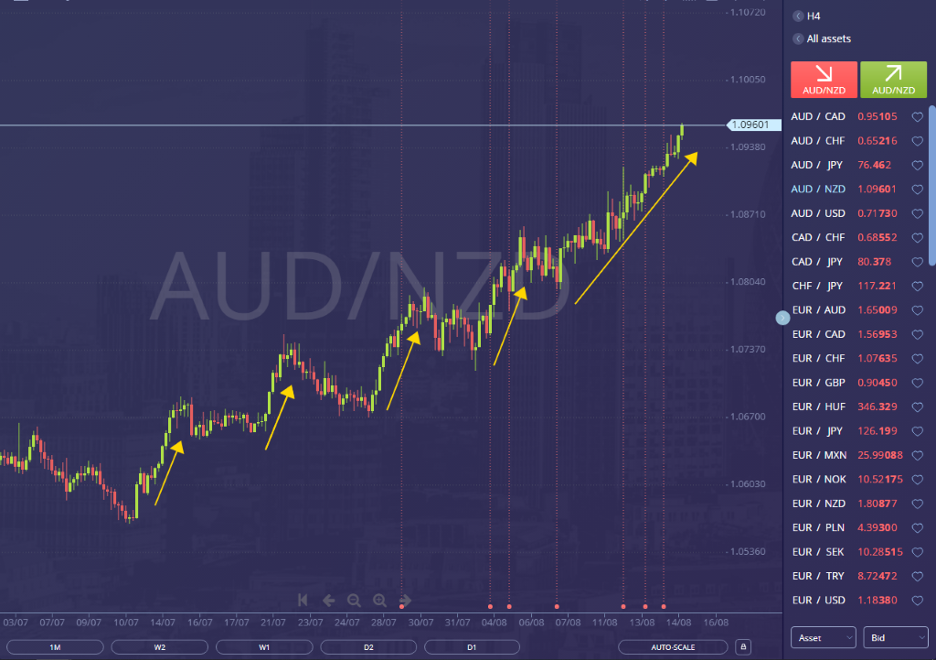
In a trending move, you will notice that larger bodies of candles are formed in the direction corelated to the trend. It signifies the “stronger” leg of the trend.
Here is an example of a trending move in the AUD/NZD H4 chart:
Retracement Move
In a retracement move, you will notice small bodied candles that moves against the trend. It is the “Weaker” leg of the trend.
Here is an example of a retracement move in the AUD/NZD H4 chart:
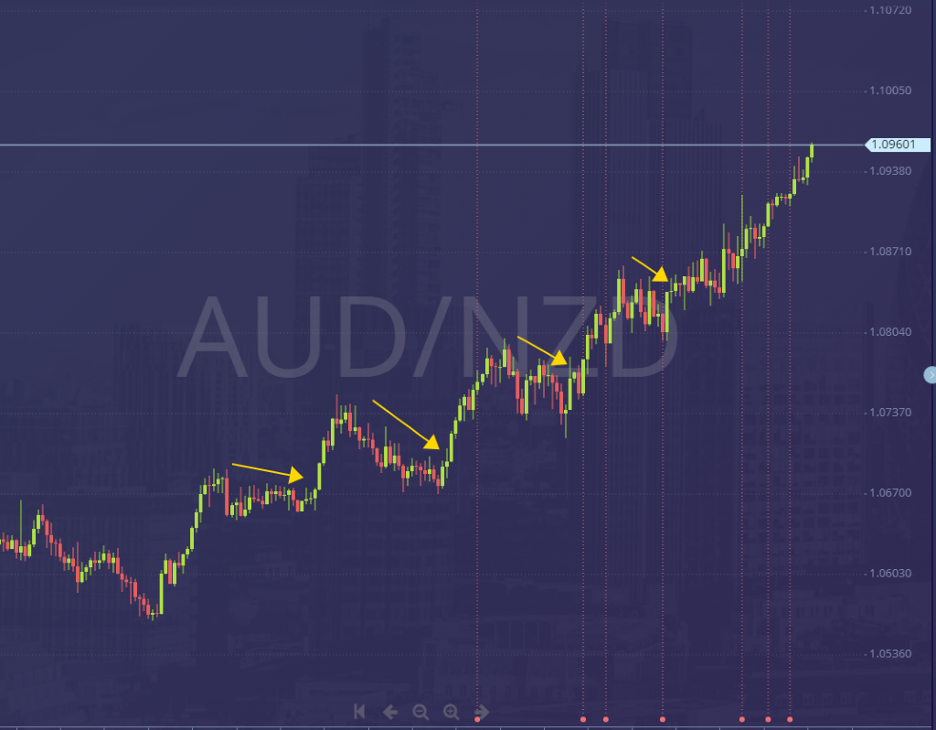
It is important to learn this because in healthy trends, you will notice a trending move followed by a retracement move. Here at Learn To Trade, we call it Phase 1(Trending move) and Phase 2 (Retracement move).
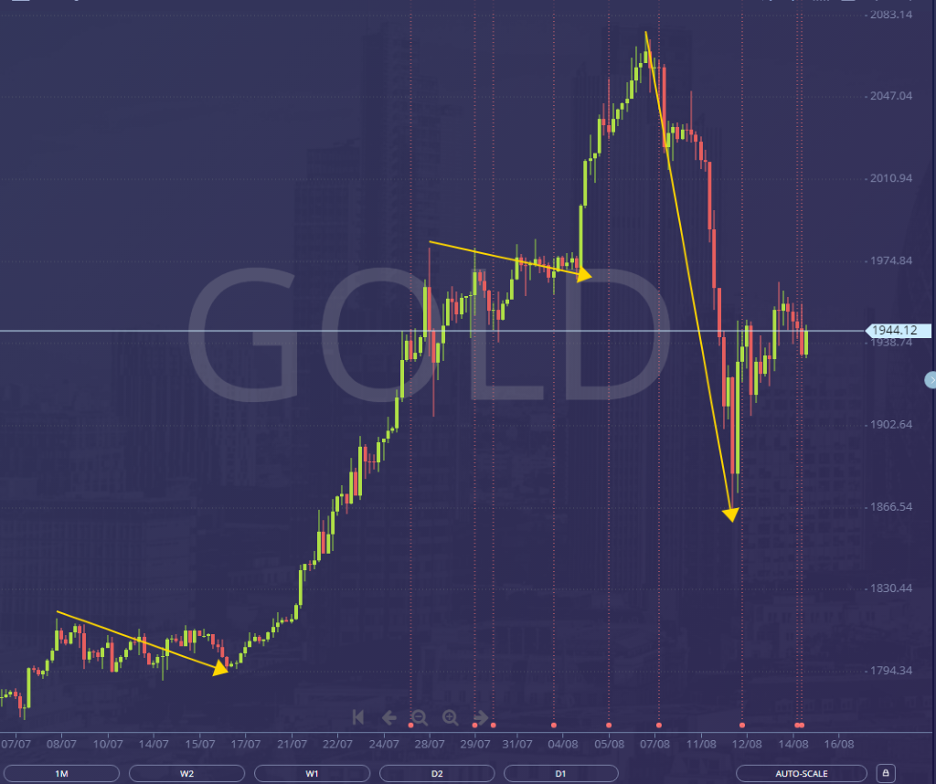
When a trend is getting weak in the case of an uptrend, the retracement has longer bodied candles instead of the trending move.
This will tell you or signals you that an opposing pressure steps in or a reversal is about to happen.
Here is an example of a longer retracement move:
When you combine this with other techniques as the ones that we will teach you further in this article, you can spot market turning points easily and find trading opportunities.
HOW TO PINPOINT MARKET TURNING POINTS WITH PRECISION
As we all know, the market does not move in the same direction all the time. It is important that we know how to distinguish when a move or a trend is getting stronger or getting weaker and further determining reversals.
This technique may be a bit complex for new traders. Here we will teach you a bit of how to use multiple timeframe analysis to confirm trends and reversals and how to enter your trades.
Here is an example on how to do it:
- On the higher timeframe (D1), wait for the price to touch a key market structures and analyze it with trendlines, support and resistance etc.
- Analyze the trending move and see if it is getting weaker by having small bodied candles
- Analyze the retracement move and if see if it is getting stronger by having larger bodied candles
- Once there is a break of structure or BREAKOUT as most traders call it, wait for a second candle to form to confirm the breakout.
Here is an example:
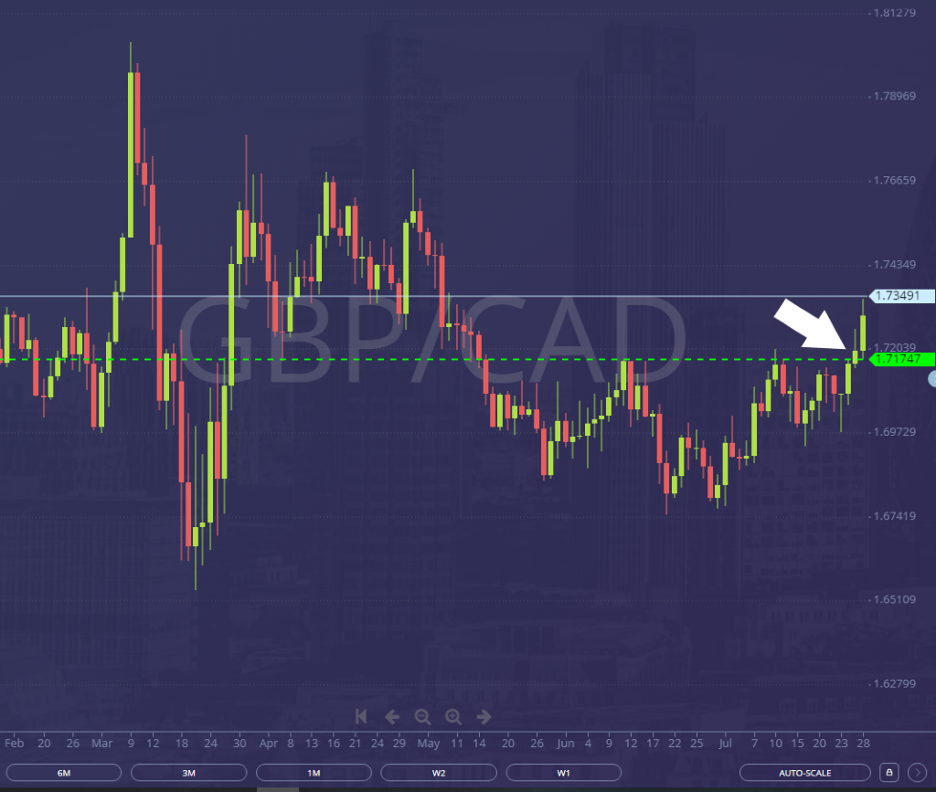
GBP/CAD D1:
In the daily timeframe of GBP/CAD. The price is under the previous Support turned Resistance.
The price could reverse higher as it is trying to breakout the area of resistance.
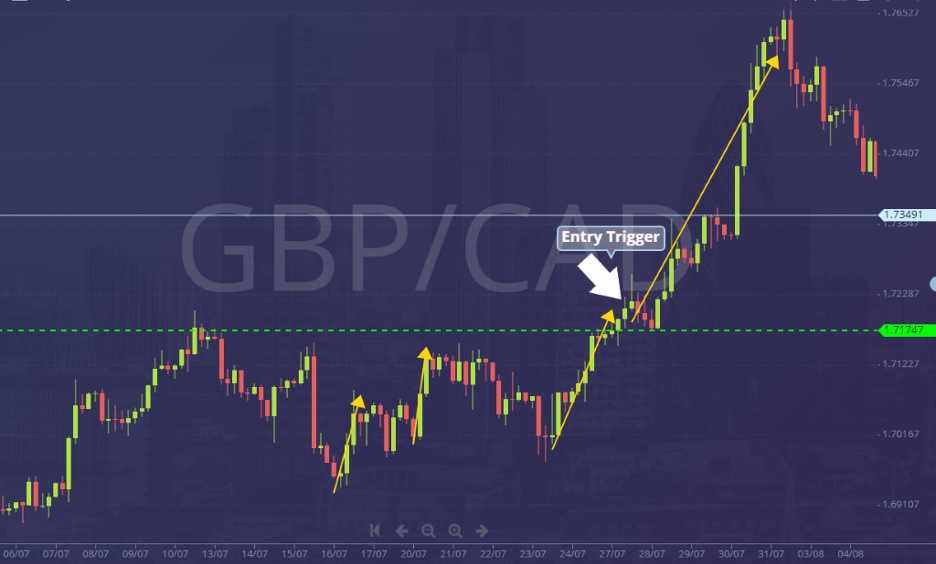
GBP/CAD H4:
In the GBP/CAD 4-hour chart, the buying pressure is getting stronger as we see trend moves getting larger.
The retracement moves are also getting weaker as the candles are getting smaller. To trade this set up in the lower H4 timeframe. You can set your entry trigger once price breaks out from the resistance area. To further confirm the trend, wait for a 2nd or 3rd candle to form.
This are the basics of price action trading that you need to know as a beginner trader. With practice and repetition of these strategies, your self-confidence in trading will drastically improve and you will see positive results.
Don’t forget to follow and subscribe for more updates about market trends, analysis, forex news, strategies and more!
Do you want to learn more about forex trading? Sign up now on our FREE forex webinar and reserve your FREE seats while it still lasts!
Risk Disclaimer:
Information on this page are solely for educational purposes only and is not in any way a recommendation to buy or sell certain assets. You should do your own thorough research before investing in any type of asset. Learn to Trade does not fully guarantee that this information is free from errors or misstatements. It also does not guarantee that the information is completely timely. Investing in the Foreign Exchange Market involves a great deal of risk which may result in the loss of a portion or your full investment. All risks, losses and costs associated with investing, including total loss of principal and emotional distress, are your responsibility.


")


