Understanding volatility and the summer months

As we reach the end of July it is worth looking at volatility, which can be notoriously hard to predict in the summer months. The Vix index is close to its average of the last 12 months, at 13.48, the average of the past year is 13.68. However, it is worth noting that since 1990, the Vix has never recorded its highest level of the year in July, that tends to come in August. Thus, we could be experiencing the calm before the storm.
Why tech could be the driver of volatility this summer
Some may argue that if volatility doesn’t rise on the back of a global trade war, deteriorating geopolitical relations or a potential synchronised tightening by the world’s leading global central banks, then what will make it rise? We believe that the answer could be found in the tech sector. If Apple does not deliver a decent set of earnings when it releases its 3Q earnings on Tuesday, then we could see stock markets start to unravel and volatility start to rise.
The reason for our focus on the tech market is two-fold. Firstly, investors have had a violent reaction to disappointing tech earnings this season. Take Facebook, its share price fell nearly 20% – bear market territory – on the back of its earnings miss last week. Another sell off could occur if Apple does not meet analyst expectations of $2.155 earnings per share later this week.
Secondly, the market has become extremely reliant on the tech sector, as you can see in the chart below. The tech sector has been the key driver of the S&P 500 for most of this year. If Apple also disappoints expectations then we may see investors lose even more confidence in the sector, and a broader decline occur, at least in the short term.
Chart 1:
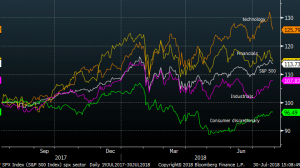
Source: Capital Index
Where to find volatility: EM FX vs. G10 FX
Also worth noting, the emerging market FX and G10 FX volatility ratio is at its highest level since 2002, as you can see in chart 2 below. This has occurred, as volatility in the G10 FX space remains extremely low, while EM FX has experienced a sharp upswing in volatility in recent weeks. The key driver for the sharp increase in this ratio is usually put down to global trade wars impacting the EM space more than the G10 space, however, we think that China’s yuan is more of an important reason for the differing volatility levels. As the yuan has declined, it has put pressure on other Asian countries’ to weaken their currencies, particularly in the EM space, as they try to remain competitive with Chinese exports. Thus, China’s currency decline is the main reason, in our view, why EM FX is more volatile than G10 FX right now.
After a further decline in the yuan at the start of this week, if you are looking for some volatility in the FX market, the EM space, particularly in Asia, is worth a look.
Chart 2:
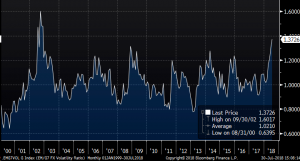
Source: Capital Index
All trading involves risk. Losses may exceed deposits.
The information here has been prepared by Learn to Trade. It is offered as an opinion and should not be considered an offer or solicitation to invest. Whilst the information provided is believed to be accurate at the time of publication, no guarantee is offered on the accuracy or completeness of the information given. Learn to Trade accepts no responsibility for the information and comments. Consequently any person acting on it does so entirely at their own risk. For a full risk disclaimer go to Learn to Trade – Risk Warning.


")


